[1]:
from pyEOF import *
import xarray as xr
import numpy as np
import pandas as pd
import matplotlib.pyplot as plt

# create a function for visualization convenience
def visualization(da, pcs, eofs_da, evf):
    fig = plt.figure(figsize = (6,12))

    ax = fig.add_subplot(n+1,2,1)
    da.mean(dim=["lat","lon"]).plot(ax=ax)
    ax.set_title("average air temp")

    ax = fig.add_subplot(n+1,2,2)
    da.mean(dim="time").plot(ax=ax)
    ax.set_title("average air temp")

    for i in range(1,n+1):
        pc_i = pcs["PC"+str(i)].to_xarray()
        eof_i = eofs_da.sel(EOF=i)["air"]
        frac = str(np.array(evf[i-1]*100).round(2))

        ax = fig.add_subplot(n+1,2,i*2+1)
        pc_i.plot(ax=ax)
        ax.set_title("PC"+str(i)+" ("+frac+"%)")

        ax = fig.add_subplot(n+1,2,i*2+2)
        eof_i.plot(ax=ax,
                   vmin=-0.75, vmax=0.75, cmap="RdBu_r",
                   cbar_kwargs={'label': ""})
        ax.set_title("EOF"+str(i)+" ("+frac+"%)")

    plt.tight_layout()
    plt.show()

%matplotlib inline
/opt/anaconda3/envs/pyEOF/lib/python3.7/site-packages/rpy2/robjects/pandas2ri.py:14: FutureWarning: pandas.core.index is deprecated and will be removed in a future version.  The public classes are available in the top-level namespace.
  from pandas.core.index import Index as PandasIndex
load sample data
note: if you got the complain of No module named ‘pooch’, please install “scikit-image”
[2]:
# load the DataArray
da = xr.tutorial.open_dataset('air_temperature')["air"]
print(da)
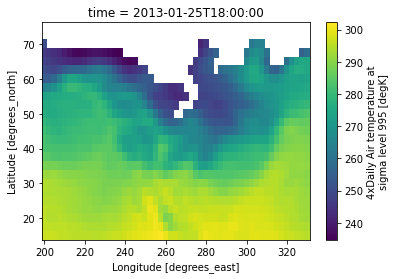
# create a mask
mask = da.sel(time=da.time[0])
mask = mask.where(mask<250).isnull().drop("time")
# get the DataArray with mask
da = da.where(mask)
da.sel(time=da.time[99]).plot()
plt.show()
<xarray.DataArray 'air' (time: 2920, lat: 25, lon: 53)>
[3869000 values with dtype=float32]
Coordinates:
  * lat      (lat) float32 75.0 72.5 70.0 67.5 65.0 ... 25.0 22.5 20.0 17.5 15.0
  * lon      (lon) float32 200.0 202.5 205.0 207.5 ... 322.5 325.0 327.5 330.0
  * time     (time) datetime64[ns] 2013-01-01 ... 2014-12-31T18:00:00
Attributes:
    long_name:     4xDaily Air temperature at sigma level 995
    units:         degK
    precision:     2
    GRIB_id:       11
    GRIB_name:     TMP
    var_desc:      Air temperature
    dataset:       NMC Reanalysis
    level_desc:    Surface
    statistic:     Individual Obs
    parent_stat:   Other
    actual_range:  [185.16 322.1 ]
[3]:
# convert DataArray to DataFrame
df = da.to_dataframe().reset_index() # get df from da
display(df.head(5))
print("DataFrame Shape:",df.shape)
| time | lat | lon | air | |
|---|---|---|---|---|
| 0 | 2013-01-01 | 75.0 | 200.0 | NaN |
| 1 | 2013-01-01 | 75.0 | 202.5 | NaN |
| 2 | 2013-01-01 | 75.0 | 205.0 | NaN |
| 3 | 2013-01-01 | 75.0 | 207.5 | NaN |
| 4 | 2013-01-01 | 75.0 | 210.0 | NaN |
DataFrame Shape: (3869000, 4)
EOF Analysis
reshape the dataframe to be [time, space]
[4]:
df_data = get_time_space(df, time_dim = "time", lumped_space_dims = ["lat","lon"])
display(df_data.head(5))
print("DataFrame Shape:",df_data.shape)
| air | |||||||||||||||||||||
|---|---|---|---|---|---|---|---|---|---|---|---|---|---|---|---|---|---|---|---|---|---|
| lat | 75.0 | ... | 15.0 | ||||||||||||||||||
| lon | 200.0 | 202.5 | 205.0 | 207.5 | 210.0 | 212.5 | 215.0 | 217.5 | 220.0 | 222.5 | ... | 307.5 | 310.0 | 312.5 | 315.0 | 317.5 | 320.0 | 322.5 | 325.0 | 327.5 | 330.0 |
| time | |||||||||||||||||||||
| 2013-01-01 00:00:00 | NaN | NaN | NaN | NaN | NaN | NaN | NaN | NaN | NaN | NaN | ... | 299.699982 | 299.100006 | 298.699982 | 298.600006 | 298.000000 | 297.790009 | 297.600006 | 296.899994 | 296.790009 | 296.600006 |
| 2013-01-01 06:00:00 | NaN | NaN | NaN | NaN | NaN | NaN | NaN | NaN | NaN | NaN | ... | 299.290009 | 298.600006 | 298.199982 | 298.100006 | 297.500000 | 297.100006 | 296.899994 | 296.399994 | 296.399994 | 296.600006 |
| 2013-01-01 12:00:00 | NaN | NaN | NaN | NaN | NaN | NaN | NaN | NaN | NaN | NaN | ... | 299.199982 | 298.699982 | 298.790009 | 298.699982 | 297.899994 | 297.899994 | 297.600006 | 297.000000 | 297.000000 | 296.790009 |
| 2013-01-01 18:00:00 | NaN | NaN | NaN | NaN | NaN | NaN | NaN | NaN | NaN | NaN | ... | 300.000000 | 299.399994 | 299.100006 | 299.100006 | 298.500000 | 298.600006 | 298.199982 | 297.790009 | 298.000000 | 297.899994 |
| 2013-01-02 00:00:00 | NaN | NaN | NaN | NaN | NaN | NaN | NaN | NaN | NaN | NaN | ... | 299.600006 | 299.000000 | 298.790009 | 299.000000 | 298.290009 | 298.100006 | 297.699982 | 297.100006 | 297.399994 | 297.399994 |
5 rows × 1325 columns
DataFrame Shape: (2920, 1325)
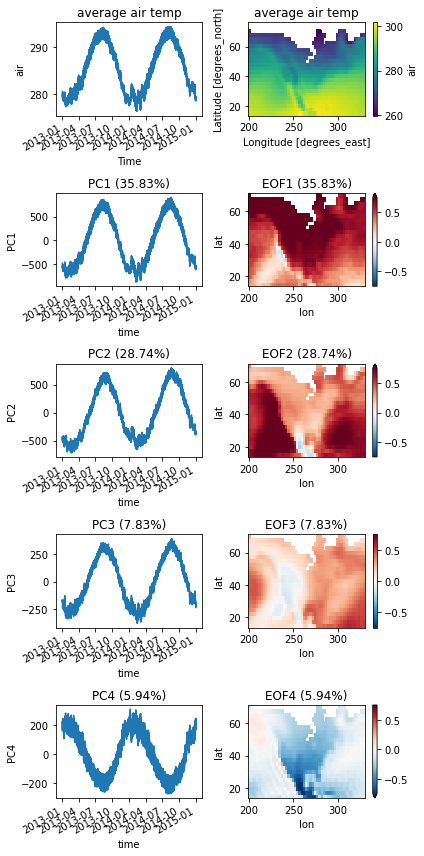
varimax rotated PCA analysis
[5]:
n = 4
pca = df_eof(df_data,pca_type="varimax",n_components=n)

eofs = pca.eofs(s=2, n=n) # get eofs
eofs_da = eofs.stack(["lat","lon"]).to_xarray() # make it convenient for visualization
pcs = pca.pcs(s=2, n=n) # get pcs
evfs = pca.evf(n=n) # get variance fraction

# plot
visualization(da, pcs, eofs_da, evfs)
/opt/anaconda3/envs/pyEOF/lib/python3.7/site-packages/sklearn/utils/extmath.py:770: RuntimeWarning: invalid value encountered in true_divide
  updated_mean = (last_sum + new_sum) / updated_sample_count
/opt/anaconda3/envs/pyEOF/lib/python3.7/site-packages/sklearn/utils/extmath.py:709: RuntimeWarning: Degrees of freedom <= 0 for slice.
  result = op(x, *args, **kwargs, dtype=np.float64)
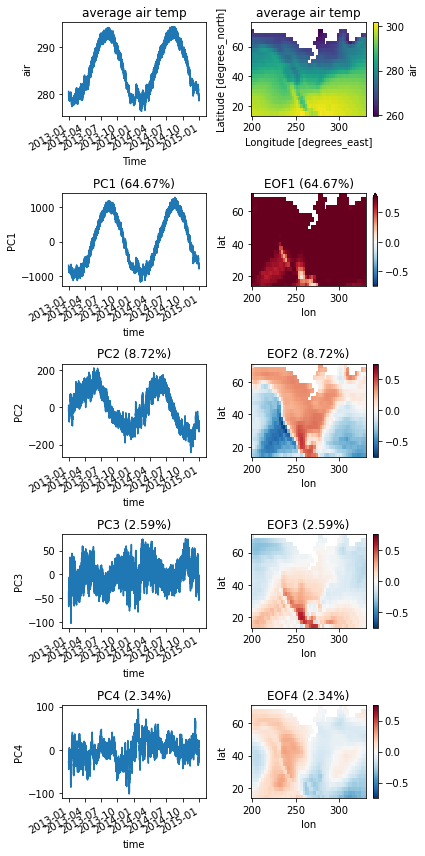
unrotated EOFs analysis
[6]:
n = 4 # define the number of components

pca = df_eof(df_data) # implement EOF

eofs = pca.eofs(s=2, n=n) # get eofs
eofs_da = eofs.stack(["lat","lon"]).to_xarray() # make it convenient for visualization
pcs = pca.pcs(s=2, n=n) # get pcs
evfs = pca.evf(n=n) # get variance fraction

# plot
visualization(da, pcs, eofs_da, evfs)
/opt/anaconda3/envs/pyEOF/lib/python3.7/site-packages/sklearn/utils/extmath.py:770: RuntimeWarning: invalid value encountered in true_divide
  updated_mean = (last_sum + new_sum) / updated_sample_count
/opt/anaconda3/envs/pyEOF/lib/python3.7/site-packages/sklearn/utils/extmath.py:709: RuntimeWarning: Degrees of freedom <= 0 for slice.
  result = op(x, *args, **kwargs, dtype=np.float64)
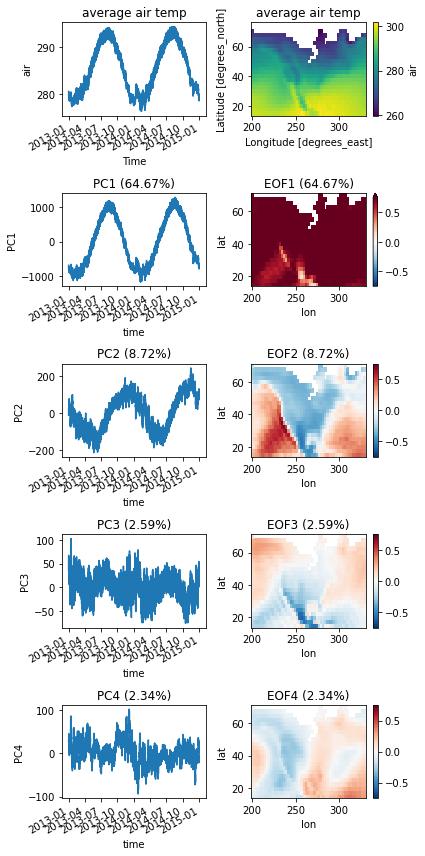
compare with Eofs package (unrotated EOFs)
link: https://ajdawson.github.io/eofs/latest/
[7]:
from eofs.standard import Eof
from sklearn.preprocessing import StandardScaler
solver = Eof(StandardScaler().fit_transform(df_data.values))

s_pcs = pd.DataFrame(data=solver.pcs(npcs=4, pcscaling=2),
                     columns = pcs.columns,
                     index = pcs.index)


s_eofs = pd.DataFrame(data = solver.eofs(neofs=4, eofscaling=2),
                      columns = eofs.columns,
                      index = eofs.index)
s_eofs_da = s_eofs.stack(["lat","lon"]).to_xarray() # make it convenient for visualization

s_evfs = solver.varianceFraction(neigs=4)

# plot
visualization(da, s_pcs, s_eofs_da, s_evfs)
/opt/anaconda3/envs/pyEOF/lib/python3.7/site-packages/sklearn/utils/extmath.py:770: RuntimeWarning: invalid value encountered in true_divide
  updated_mean = (last_sum + new_sum) / updated_sample_count
/opt/anaconda3/envs/pyEOF/lib/python3.7/site-packages/sklearn/utils/extmath.py:709: RuntimeWarning: Degrees of freedom <= 0 for slice.
  result = op(x, *args, **kwargs, dtype=np.float64)